Google Analytics is a powerful tool for businesses of all sizes, allowing you to understand your customers better, and is one of the most popular free analytic tools available online. It allows you to track and analyze the performance of your website including:
· Allows you to measure your website’s performance quickly.
· Keeps track of how many visitors your website gets.
· Details demographic information about your website’s visitors such as age, gender, country, etc.
· How many visitors access your site via mobile device vs. desktop?
· See if your marketing efforts are working.
· Optimize website pages to boost conversions.
This guide aims to show you what Google Analytics is, how to set it up, and to familiarize yourself with some of the most important metrics and terms they utilize.
Why Are Analytics important?
Google Analytics provides a wealth of information about your website, your marketing strategy, and your audience. It is part of a range of tools provided by Google that include Google Search Console and Google Tag Manager. Google Analytics allows you to monitor aspects of your website you may have not even considered through generated reports to display the data to you.
Here are some key benefits of using Google Analytics:

About Your Users
- The number of visitors to your site
- The types of devices used to access your site
- Most common browsers your visitors use
- Demographics of visitor to your site

How They Found You
- Sites that refer traffic to your site
- Social media channels that direct to your site
- Paid advertisement campaign effectiveness
- User traffic by keywords
Website Navigation
- Amount of time spent on each page
- The most popular pages on your site
- Pages that users tend to exit your site from
- How landing pages affect user retention
User Interaction
- Amount of time spent on your site
- Number of pages visited per session
- What pages are the most and least viewed
- Conversions like contact form submission and sign-ups
Google Analytics Account Set-up
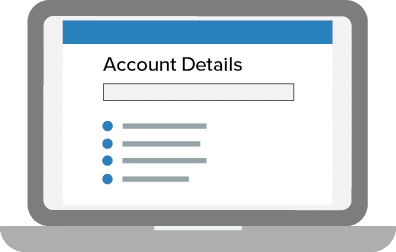
Create your account by choosing an account name, which data you want to share with Google, what you want to measure (website, apps or both), and your website name, industry and time zone.
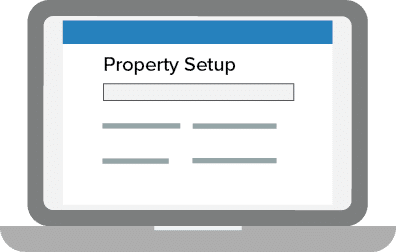
The next step is to choose which account you want to add the property (your website) to. At this point, you will create and name your property and enter the website URL.

Next, go to your account and add a view to your property by using the menu to create a view, name the view and select the type of view (web or app).
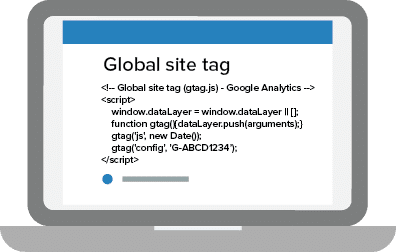
Creating a property will give you access to a unique ID that can be used for tracking, as well as a global site tag, which is a tracking ID code you must add to every page you want to track.
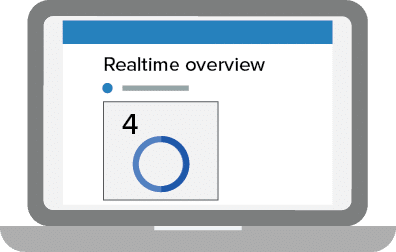
Finally, go to your Google Analytics portal, and make sure that your code is working properly. You can do this by visiting the Real-Time Reports section as you click around your website on a different browser tab or on your mobile device.

Most website builders like Wix and SquareSpace have support for analytics tracking. For websites built on WordPress, there are many plugins that allow you to select which pages to add your tracking code and even provide a dashboard to your admin for quick analytics reporting.
Google Analytics Dashboard
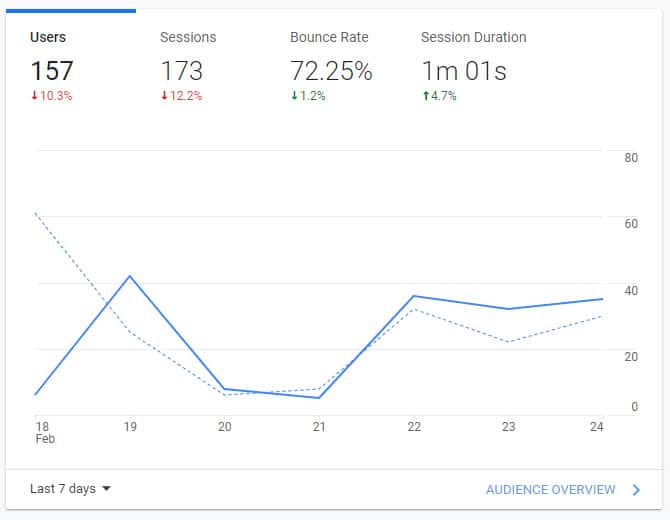
The Google Analytics home dashboard displays pertinent data about how your well your website is performing. Here, you can see user data, demographics, ad campaigns and track goals.
Analytics Overview
- Users: Visits to your site over the last 7 days.
- Sessions: All of the actions a users takes during a visit.
- Session Duration: Average amount of time a user is on your site.
- Bounce Rate: Shows how often a visitor only views one page and them leaves your site.
Real-Time Data
A real-time report shows how many active users there are on your site, your most active pages, the top sources of referral traffic and the top locations from which users are visiting.
User Acquisition
Shows how users are coming to your website by showing you metrics such as the total number of visits, new visits and repeat visits; traffic sources; and organic traffic rate.
User Location
A map showing where the traffic on your site is coming from by country and the top countries generating traffic to your site.
Page Visits
These pages are getting the most visits by users within the past 7 days. Each page URL is ranked by pageview for the designated period and provides a monetary value for each page’s performance, if being tracked.
Trending Active Users
This graph shows active users to your site broken down by day, week and month, and how those numbers are trending over the designated period.
Device Overview
Here, you can see which are the most popular devices for visitors to use to browse your site over the designated period. Mobile, Tablet and Desktop devices are broken down by percentage of users.
User Retention
This is a breakdown of how well your site is getting return visitors from week to week. The first column shows the number of new visitors with other columns showing how many come back in the following weeks.
Google Ads Campaigns
This overview of your Google Ads performance shows how well your paid search campaigns are generating clicks and how much revenue each is bringing in.
Goals Overview
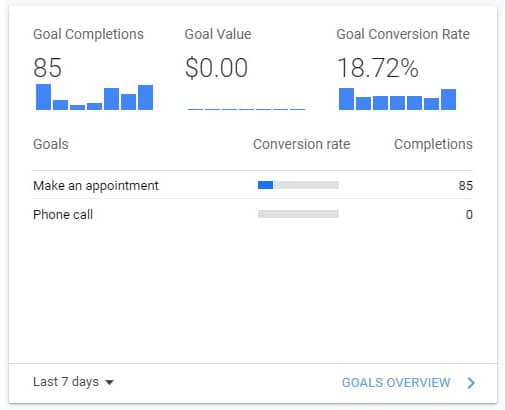
As you create goals, you will see how well those goals are performing by completion, goal value, and goal conversion rates.
Analytics Overview
- Users: Visits to your site over the last 7 days.
- Sessions: All of the actions a users takes during a visit.
- Session Duration: Average amount of time a user is on your site.
- Bounce Rate: Shows how often a visitor only views one page and them leaves your site.
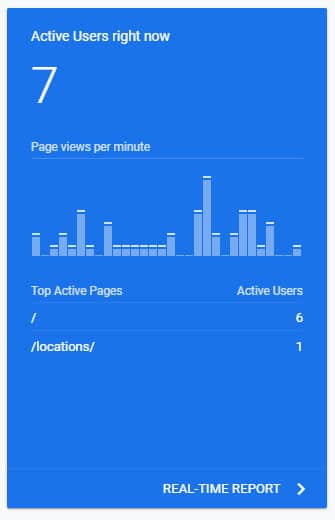
Real-Time Data
A real-time report shows how many active users there are on your site, your most active pages, the top sources of referral traffic and the top locations from which users are visiting.
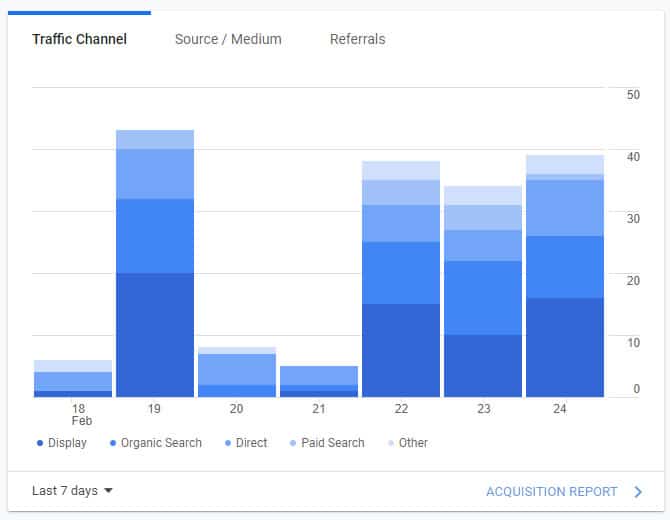
User Acquisition
Shows how users are coming to your website by showing you metrics such as the total number of visits, new visits and repeat visits; traffic sources; and organic traffic rate.
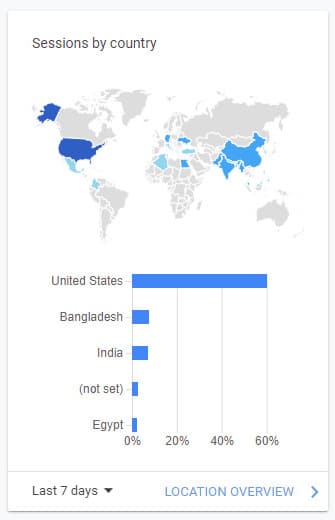
User Location
A map showing where the traffic on your site is coming from by country and the top countries generating traffic to your site.
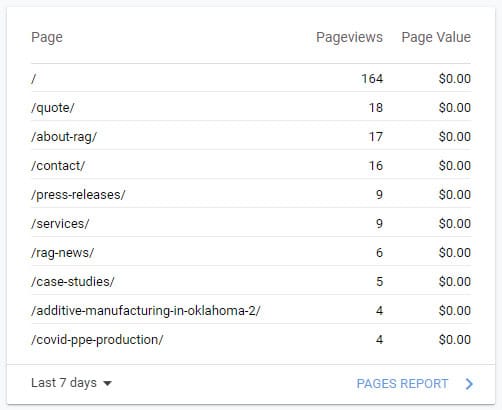
Page Visits
These pages are getting the most visits by users within the past 7 days. Each page URL is ranked by pageview for the designated period and provides a monetary value for each page’s performance, if being tracked.
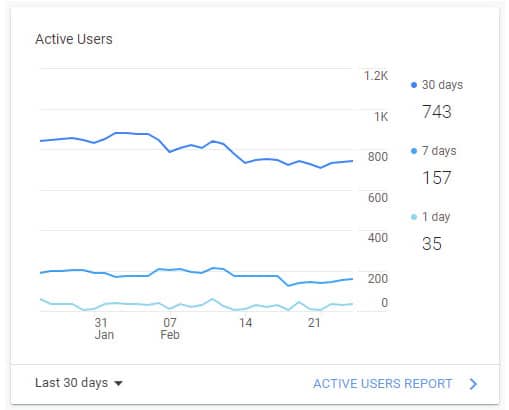
Trending Active Users
This graph shows active users to your site broken down by day, week and month, and how those numbers are trending over the designated period.
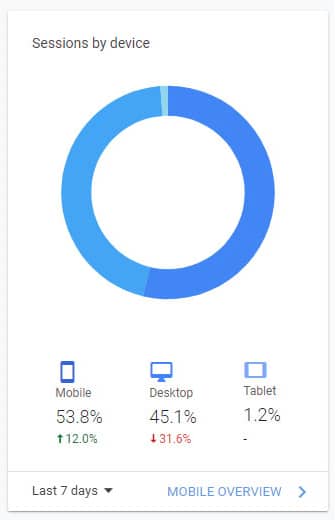
Device Overview
Here, you can see which are the most popular devices for visitors to use to browse your site over the designated period. Mobile, Tablet and Desktop devices are broken down by percentage of users.
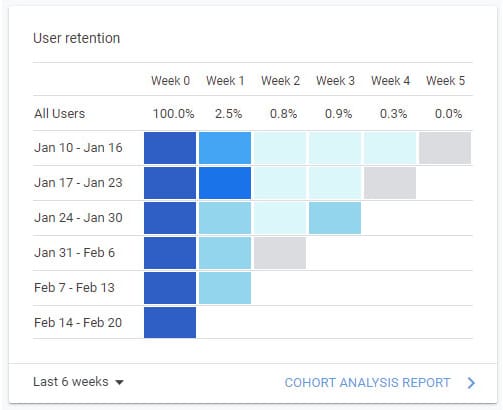
User Retention
This is a breakdown of how well your site is getting return visitors from week to week. The first column shows the number of new visitors with other columns showing how many come back in the following weeks.
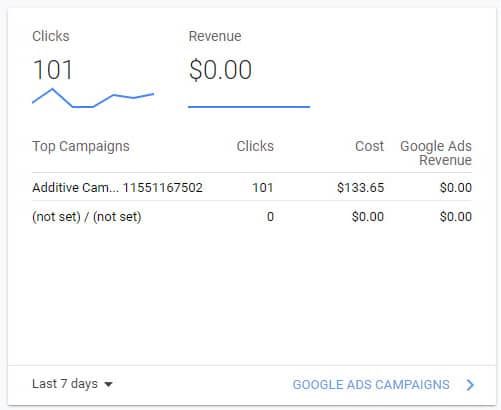
Google Ads Campaigns
This overview of your Google Ads performance shows how well your paid search campaigns are generating clicks and how much revenue each is bringing in.
Goals Overview
As you create goals, you will see how well those goals are performing by completion, goal value, and goal conversion rates.
Using Analytics To Improve Site Performance
Remove Non-Performing Pages
Use the Pages Report to identify pages that are not being seen by visitors and remove them if necessary. This will streamline your site and make it easier to navigate. Underperforming pages can also be combined together to reduce page bloat and make your content more concise.

Optimize for devices
The Top Devices report allows you to see just how many users are viewing your site from a tablet or mobile device. You should always check your site on different devices and make sure your site is optimized for viewing on different devices.

Measure social media traffic
View your social media acquisitions to identify where visitors are getting referred from. Focus on the platforms that give the most value to your visitors, or create campaigns to drive more traffic from underperforming social sites and measure their success.

Reduce your bounce rate
When visitors come to your site and do not visit any other pages before leaving your site, they increase your bounce rate. Analyze your site pages to see where users are bouncing the most and improve on the content or make the page more visually appealing to increase user engagement.

Tracking User Behavior

Track returning visitors
Your site should be offering incentives to return to your site, whether with new or updated content or enticing with discounts on future visits. Look at your audience behavior to see how many visitors are new and how many are returning to your site.

Find where visitors decide to leave
If you have an ecommerce or subscription-based site, you want to know if people are not completing the checkout process and where they fall off. You can add pop-ups on pages where visitors bounce or create a Goal Funnel to track how far visitors get in the checkout process.
Track where visitors go
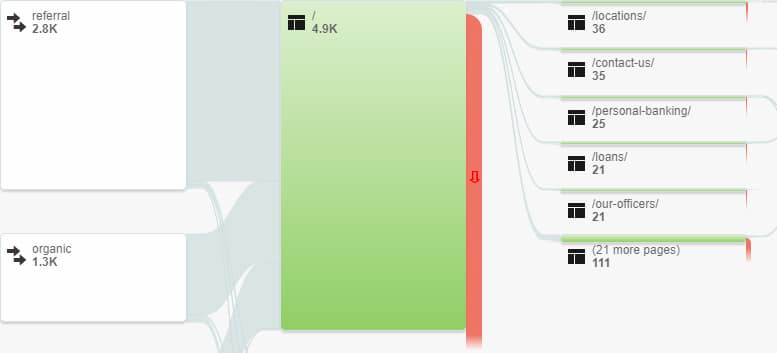
The path users take through your website can give you a lot of info on how easy your site is to navigate. User Flow tracks a user as they interact with your site pages, from entry page to exit page. This can help determine if your site users are finding the content you want them to.
Create Goals For Your Site

Set up a new goal
Under the Goals section, you can create custom goals or use a template to track specific interactions with your site.

Track user conversions
If a user creates an account or completes a purchase, this counts as a conversion. Thank You pages can help indicate when a conversion goal has been achieved.

Increase user engagement
How long a user spends on a page can determine it’s effectiveness. Create goals for minimum durations to see if your content is keeping your visitor’s attention.
Google Analytics can be a powerful tool to analyze your site performance, user engagement, and track the success of your ad campaigns. Harnessing this power can be a daunting task, there is a lot of information that can be extremely helpful to growing your business. This information can be used to turn your website into an effective tool to understand how long users stay on your site, how they interact, and where it needs improvement. Thankfully, there is help available that understands how to leverage all of the data from Google Analytics and lead you to a path of success. Contact Momentum3 Growth to begin your journey toward accelerating your online presence.


